The activity feed is a pattern used to show changes over time. It must make pages, communities, and other objects feel alive. It will arise in many different places throughout WeWrite. The highest-importance activity feed items will escalate to Notifications. Thus, activity feed objects can be seen as low-importance Notifications.
We need to figure out the clear delineation between activity feed and version history views. Version history will be horizontally scrollable as if it were a filmstrip, activity feed will be vertically scrollable like a social feed.
Data structure
User - who did the activity
Relative time - tap or hover to view absolute time
Change description
± Characters (images could be counted as one character, hiding the silly fact that they'll likely be a URL in reality)
Are characters the correct count method? Perhaps words? But what about typo fixes with no words being changed?
Visualizations
Additions and deletions (characters) over time could be shown as a dual bar chart with positive and negative planes above and below the zero line
Images will be shown in list, perhaps there's a clever way of showing images in the timeline view too
GitHub activity overview
Could take inspiration from GitHub activity feed too
Where does Activity Feed appear?
Following list
Comparison
Here's what the MediaWiki activity feed looks like. We can do much better.

Here's a sketch showing how the MediaWiki activity feed could be made more skimmable as a table view

This was from August of 2021, here's the Tweet lol.
Instead of improving MediaWiki, now I'm building WeWrite to compete with it.
Progress update from 2023-05-02

Adding some small bar charts to show the relative size of the addition or subtraction. (these are not to scale)
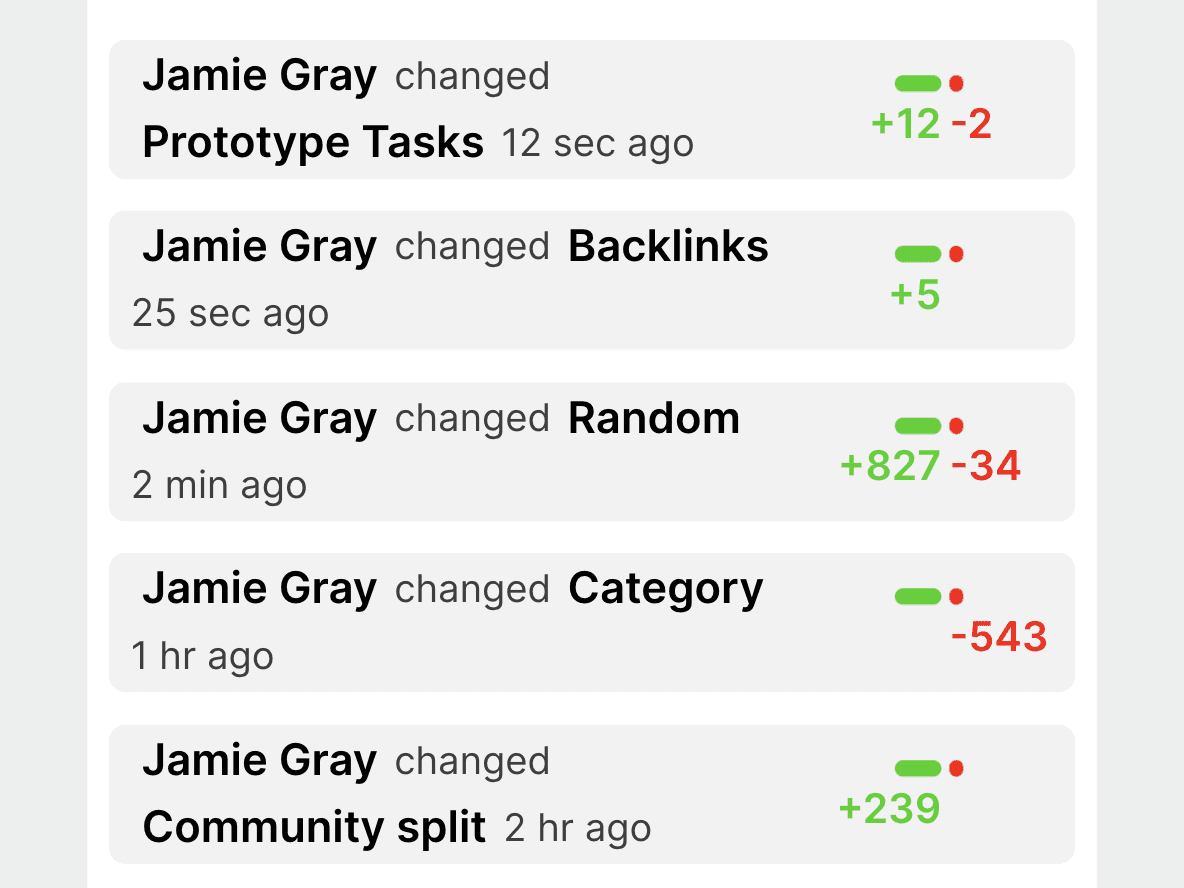
Since it wasn't really clear what these little charts on the right were, I created an expanded state which explains that these are character counts.
Here's the sketch (j. 18, pg. 101)

and here's the result

This is getting cluttered, it probably needs to be simplified.

Here's the slightly simplified version, without the bar chart.